Will it Blend?
In the previous article Seeds of Discontent, I jotted down a few benchmarks to compare OS X, Windows and Linux performance at a system level. In this article, I explore further a test built around graphics rendering engines. In particular, I was impressed by Sintel, an open source movie built with (among others) Blender.
I don’t know how long it takes to assemble the movie from source assets into a shipping product but I’ll venture it is quite a compute intensive process. I got the idea for this benchmark while reading on the sintel.org home page that the project is re-rendering the film for 4K and that it should be ready later this year (still a few months away). I didn’t know what 4K was so I looked it up. That lead me to compile a table of film formats and supported Frames per Second (FPS). I also appended three rows for HDTV of which only 720p and 1080p are real. 4320p is something bandied about as future but I couldn’t find material online that would lead me to believe it’s anything but a concept. I included it to define the upper envelope edge. (Note: different formats support different levels of FPS.)
Fomat   Width    Height    Frames per Second (FPS)
------- ------   ------  ----------------------------
2k 16:9 (2,048 × 1,152)  24, 25, 30, 50, 60, 100, 120
2K 2:1  (2,048 × 1,024)  24, 25, 30, 50, 60, 100, 120
2K ANA  (1,408 × 1,152)  24, 25, 30, 50, 60, 100, 120

3k 16:9 (3,072 × 1,728)  24, 25, 30, 50, 60
3K 2:1  (3,072 × 1,536)  24, 25, 30, 50, 60
3K ANA  (2,112 × 1,728)  24, 25, 30, 50, 60

4k 16:9 (4,096 × 2,304)  24, 25, 30
4K 2:1  (4,096 × 2,048)  24, 25, 30
4K HD   (3,840 × 2,160)  24, 25, 30
4K ANA  (2,816 × 2,304)  24, 25, 30

4.5k WS (4,480 × 1,920)  24, 25, 30

720p    (1,280 ×   720)  24, 25, 30, 50, 60
1080p   (1,920 × 1,080)  24, 25, 30, 50, 60
4320p   (7,680 × 4,320)  24, 25, 30, 50, 60
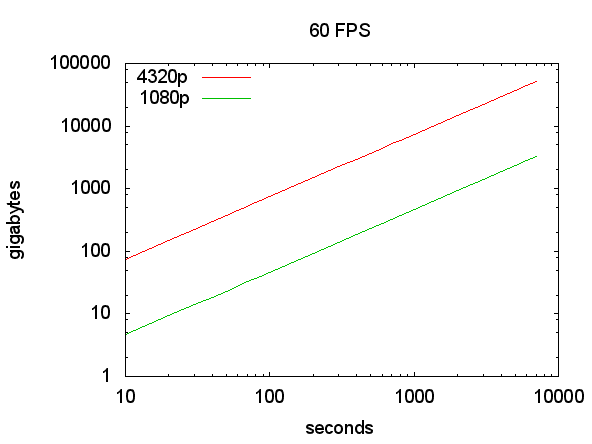
From this, I build a spreadsheet table of “Gigabytes per Second” of uncompressed data and converted the table into a set of data files compatible with gnuplot. Below are plots for 24 and 60 FPS for three formats.
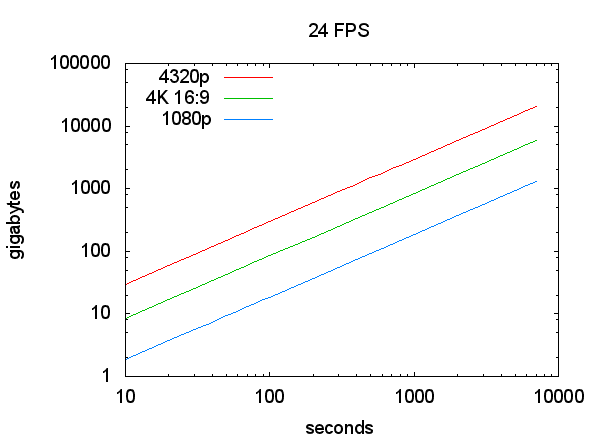
I chose 24 FPS since it is a standard film frame rate. I excluded 25 and 30 FPS since they were so close to 24 FPS that they didn’t add any additional insight into designing the test. (25 and 30 FPS happen to be half of 50 and 60 FPS, which I discuss next). One datapoint to consider is that Blu-Ray supports 1080p at no greater than 24 FPS.
Just as the world is split between driving on the left or right hand side of the road, the world’s electrical power is split between 50 and 60 Hz. Neither is right or wrong but they are different and the two don’t mix well (like people driving on both the left and right side of the same road don’t mix well). I currently live in a 60Hz world so I biasedly chose the familiar but I could have easily chosen 50Hz. They are so close to each other in context of this exercise that the differences are negligible.
I chose two HD formats (4320p and 1080p) plus one film format (4K 16:9). The film format file size falls between the two HD formats. Note that 4K doesn’t support a frame rate obove 30 FPS and isn’t included in the 60 FPS graph.
Note that I haven’t included compression in this test as I believe it to be a different strain on the system.
My thoughts for the blender test was to establish a benchmark that would be inherently obvious and understandable to anyone, especially to those without any previous knowledge of video rendering or video formats. It’s more intuitive to say, “This system renders the video 1000 times slower than real time.” It also makes for a nice roadmap chart. Consider time on a linear x-axis and rendering ratio on a logrithmic y-axis.
A second roadmap milestone map could be what format/fps combination(s) achieve real time rendering status for a specific system on a specific date.
It would be interesting to see the performance of an ad hoc office cluster vs. a 40 foot shipping container of specialized hardware. If this sounds crazy, juxtapose any of the recent systems from Tom’s Hardware System Builder Marathon against the original IBM PC. (Or the ENIAC ;^)
In the conclusions section, I’d want to see analysis/conjecture about the test results regarding system bottlenecks. In an attempt to compare the systems, I’d also want to see the individual system price divided by the performance ratio. For example,
System A
Cost         $1200 USD
Ratio        0.0005245  (1830:1)
Cost/Ratio   2,196,000

System B
Cost         $1153 USD
Ratio        0.0005736  (1735:1)
Cost/Ratio   2,021,209

Cost Comparison
System A  : System B
    1,200 : 1,153
    1.040 : 1  (A is 4% more expensive than B)

Ratio Comparison
System A  : System B
    1,830 : 1,735
    1.055 : 1  (A is 5.5% slower than B)

Cost/Ratio Comparison
System A  : System B
2,196,000 : 2,021,209
    1.086 : 1  (A is 8.6% more expensive to
                to finish the same job as B)
If one starts to compare operating environments (Windows 7, OS X, Ubuntu, Fedora) on the same system and then repeats those tests across various systems (Dell, Apple, Whitebox), we start to get an apples to apples comparison in price, performance and price/performance ratios.
Note: the spreadsheet (numbers, exported to excel), data files, gnuplot scripts and images are available for download.
[update 2010-10-05: I just read at thenextweb.com that rendering Avatar requires 1 petabyte of drive space. That’s in 3D but it still makes me wonder why there’s a wide gap between my calculations of a hypothetical 2 hour movie and that of Avatar. The article at information-management.com gives a reference of 17.28 gigabyte/minute. At 166 minutes, this is 2.8 terabytes (a long way off from a petabyte). Perhaps there are a lot of intermediate stages for each frame which must be saved? Nevertheless, I believe the test is still interesting.]